Work flows algorithm profiling#
Summary#
Due to the need of investigation of algorithms performance issues, the proper method is introduced. It consists two to parts: special mantid build and analytical tool.
Note
Available for Linux only.
Mantid build#
On linux the profiler is built by default but to enable profiling, the properties must be set. Enabling the profiler will create a file that contains the time stamps for start and finish of executed algorithms with ~nanosecond precision in a very simple text format.
Adding more detailed information#
More detailed information can be added to individual function calls in C++ with the help of std::chrono.
At the top of the function create a “start time”
const auto startTime = std::chrono::high_resolution_clock::now();
Then at the bottom of the section being timed, add it to the profiling output
addTimer("createOutputWorkspacesSplitters", startTime, std::chrono::high_resolution_clock::now());
where createOutputWorkspacesSplitters is the name that will appear, similar to a child algorithm.
The names in the report will be suffixed with 1 because the tool thinks they are the “default version” of a child algorithm.
An example of this can be found in FilterEvents.cpp.
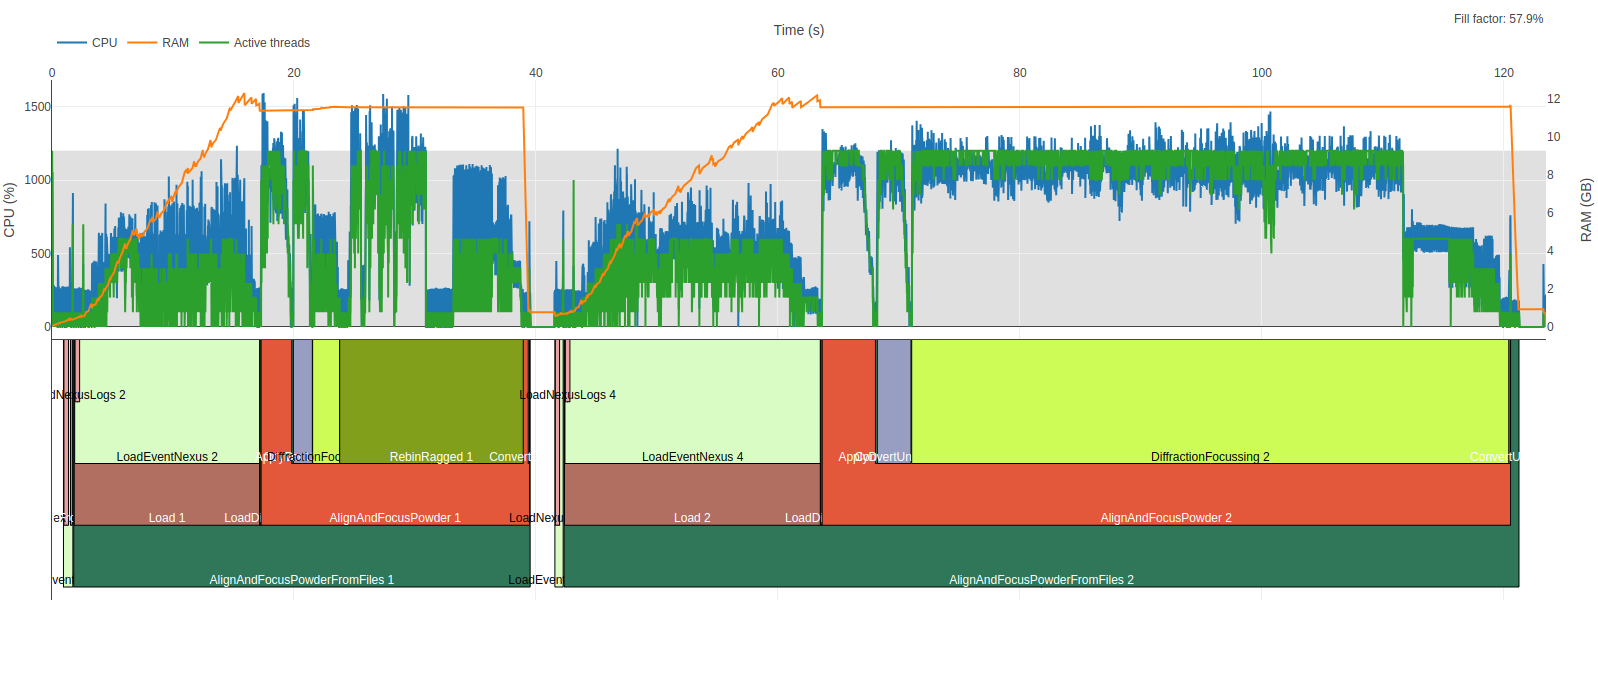
Analysing tool#
The mantid-profiler project provides the nice graphical tool to interpret the information contained in the dumped file. The project has more detiled instructions, but in general
python path/to/myscript.py & mantidprofiler $!
The & puts the python process in the background.
The $! is the process-id (PID) of the last process run and allows mantid-profiler to attach to the process.