Profiling with Valgrind
Summary
Describes how to use the callgrind plugin to the valgrind tool set to profile your code.
Note: Valgrind is a Linux only tool
Installation
You will need to install both valgrind & the visualizer tool kcachegrind - both of which should be available in your distribution’s repositories.
Ubuntu
>> apt-get install valgrind kcachegrind
Red Hat/Fedora
>> yum install valgrind kcachegrind
Preparation
To be most effective valgrind requires that debugging information be present in the binaries that are being instrumented, although a full debug build is not required. On gcc this means compiling with the -g flag. For Mantid the recommended setup is to use a separate build with the CMAKE_BUILD_TYPE set to RelWithDebInfo. This provides a good balance between performance and availability of debugging information.
Running the Profiler
The profiler can instrument the code in a number of different ways. Some of these will be described here. For more detail information see the callgrind manual.
During execution the callgrind tool creates many output file named callgrind.output.pid.X. For this reason it is recommended that each profile run be executed from within a separate directory, named with a description of the activity. This allows the separate profiled runs to be found more easily in the future.
Beware: The code will execute many times (factors of 10) slower than when not profiling - this is just a consequence of how valgrind instruments the code.
Profile a Whole Program Run
This is the simplest mode of operation. Simply pass the program executable, along with any arguments to the valgrind executable:
>> valgrind --tool=callgrind --dump-instr=yes --simulate-cache=yes --collect-jumps=yes <executable> [args...]
Profile Selected Portions of the Code
For larger pieces of code it can be quite likely that you wish to profile only a selected portion of it. This is possible if you have a access to recompile the source code of the binaries to be instrumented as valgrind has a C api that can be used talk to the profiler. It uses a set of macros to instruct the profiler what to do when it hits certain points of the code.
As an example take a simple main function composed of several function calls:
int main()
{
  foo1();
  bar1();
  foo2();
  foo3();
}
To profile only the call to bar1() then you would do the following
to the code:
#include <valgrind/callgrind.h>

int main()
{
  foo1();
  CALLGRIND_START_INSTRUMENTATION;
  CALLGRIND_TOGGLE_COLLECT;
  bar1();
  CALLGRIND_TOGGLE_COLLECT;
  CALLGRIND_STOP_INSTRUMENTATION;
  foo2();
  foo3();
}
After recompiling the code you would then run the profiler again but this time adding the –instr-atstart=no –collect-atstart=no flags, like so
>> valgrind --tool=callgrind --dump-instr=yes --simulate-cache=yes --collect-jumps=yes --collect-atstart=no --instr-atstart=no <executable> [args...]
The –instru-at-start=no is not strictly necessary but it will speed up the code up until the profiling point at the cost of the less accuracy about the cache usage. See here more details.
Visualisation
Callgrind produces a large amount of data about the program’s execution. It is most easily understood using the kcachegrind GUI tool. This reads the information produced by callgrind and creates a list of function calls along with information on timings of each of the calls during the profiled run. If the source code is available it can also show the lines of code that relate to the functions being inspected.
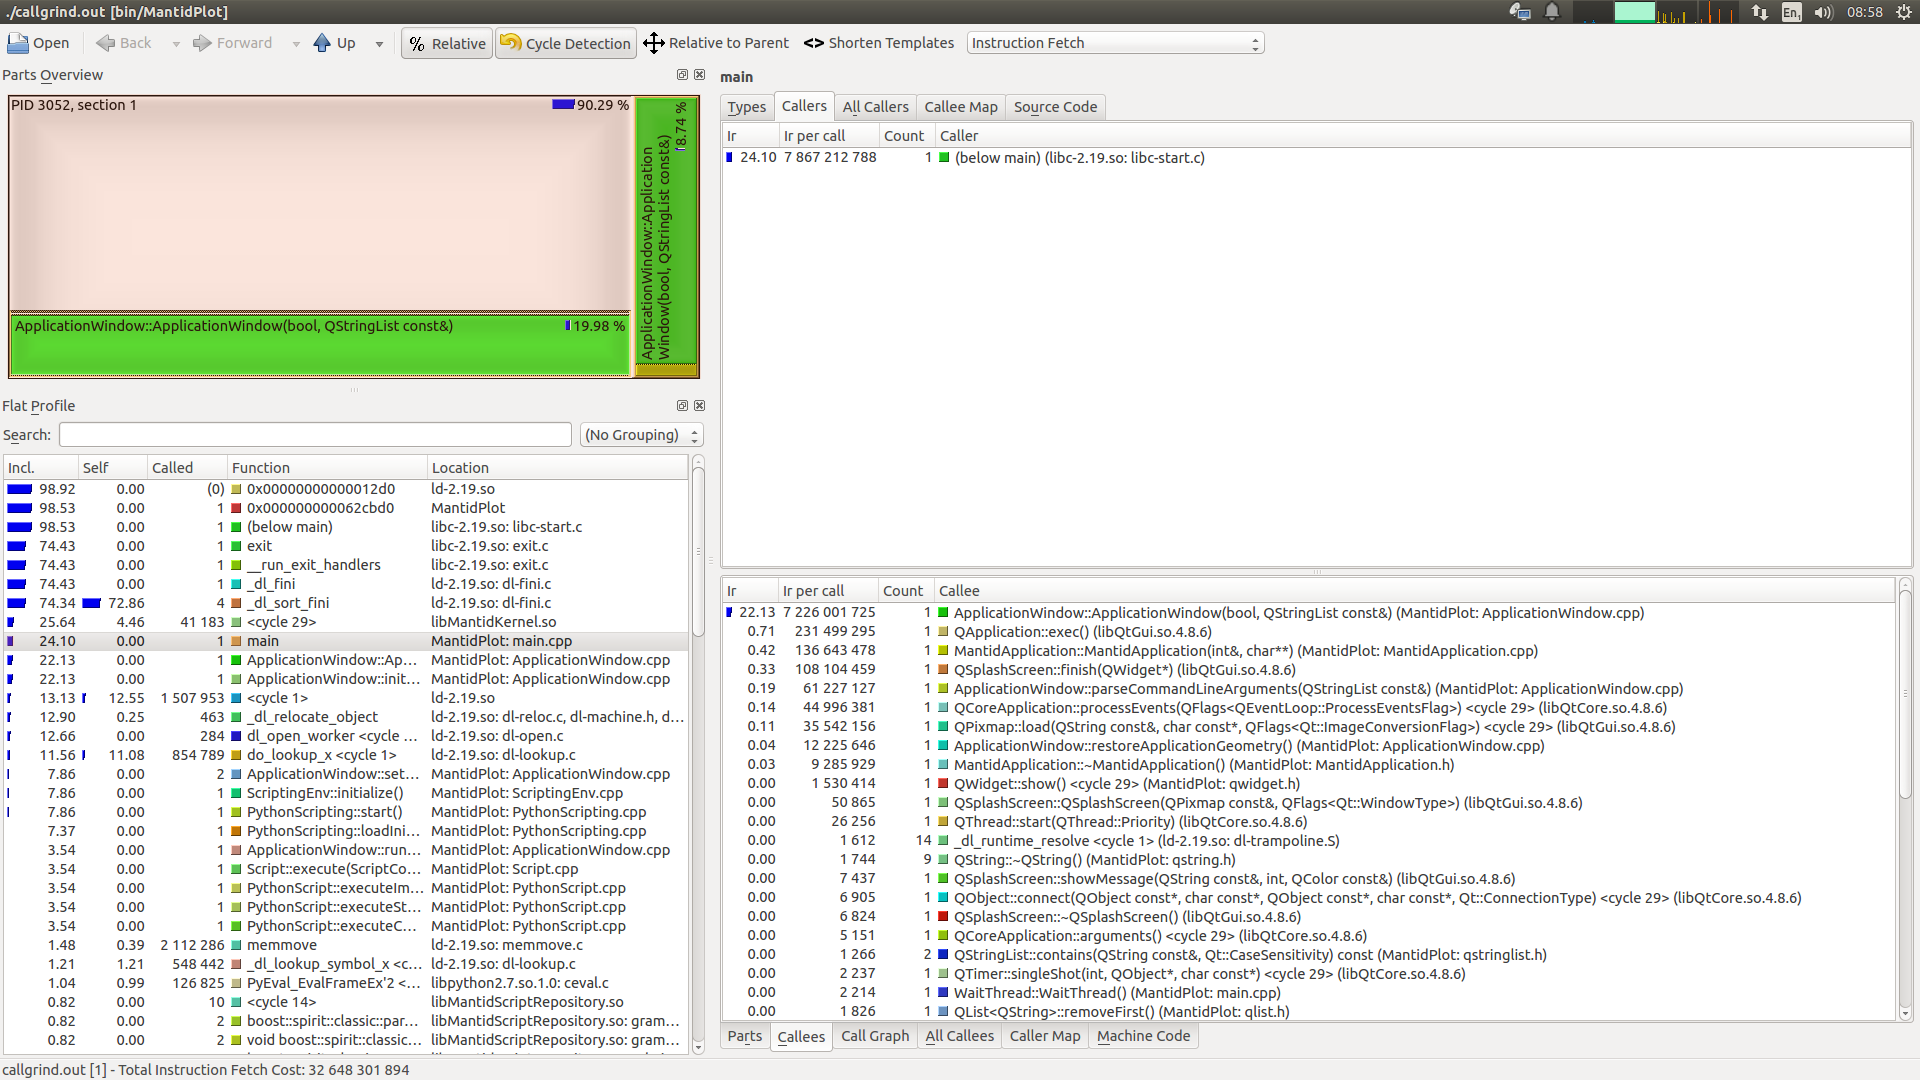
Example of KCachegrind display a profile of MantidPlot starting up and closing down
By default KCachegrind shows the number of instructions fetched within its displays. This can be changed using the drop-down box at the top right of the screen. The Instruction Fetch and Cycle Estimation are generally the most widely used and roughly correlate to the amount of time spent performing the displayed functions.
Some of the key features display are:
Flat Profile View
Incl. - Sum of itself + all child calls as a percentage of the whole. Programs with little static allocation should have main() at 100%. Units are those selected by the to-right drop-down
Self - Exclusive count spent in the selected function. Units are those selected by the to-right drop-down
Called - Number of times the function was called.
Function Call Detail
Click on function in flat view to get more detail on the right.
Displays details about the selected function call plus details about all child calls it made. The call graph tab at the bottom gives a nice graphical overview of the relative function cost.